Your business needs data the way it needs funding. Every business, no matter what stage of development it’s in, needs a means to collect, analyse, and interpret relevant data. KPIs, Metrics and Analytics are significant in making informed decisions on various aspects including business scalability and product/service specifications. Startup Analytics, specifically, are most helpful to early-stage startups to prove market traction and growth potential to investors.
What are KPIs, Metrics and Analytics?
Key Performance Indicators
Key Performance Indicators (KPIs), also known as performance metrics, are measurable values that provide a complete picture on where a business stands. These values do the following:
- help businesses monitor & measure progress in relation to business goals
- support decision-making when improving effectiveness and performance
- show how you are doing compared to set objectives since they are defined based on business goals within specific periods of time
Metrics
Metrics are a “quantifiable measure” or defined numbers/ values gauge the level of performance, quality and improvement (or lack thereof) of a business. Specifically, metrics are:
- accurate measurements what are going well & how things are possibly correlated; and
- influence the direction in critical decision-making
Analytics
”Analytics is the measurement of movement towards your business goals
Ben Yoskovitz and Alistair CrollAuthors of Lean Analytics
Analytics, essentially are the examination, exploration and interpretation of the metrics or data tracked. It is further defined as:
- the process of deciphering metrics (or a combination of) into meaningful patterns and insights for later decision-making.
- In early-stages startups, analytics help determine product-market fit by helping understand the target users and how the product can solve a specific market problem
More details on KPIs, Metrics and Analytics below:
Importance of KPIs, Metrics and Analytics
Analytics Give Meaning to Metrics
Metrics revolve around tracking and presenting data. They are informational–they represent the current status of different measures that a business is tracking. While metrics also provide insight, analytics give a deeper and more powerful understanding of data.
Considering both historical and present data, analytics does the following:
- help find and define the most valuable data such as relationships
- interpret collected data based on chosen metrics–how are metrics correlated?
- define or redefine current business processes–are workflows effective?
- Identify the status of a product or service–for early startup stages, it’s most essential to determine product-market fit
- provide educated predictions of customer behaviour and business performance such as engagement/retention, conversions to active or paid usage and forecasting revenue over specific time periods
In a few words, analytics give meaning to metrics.
Metrics and Analytics provide a base for you to make necessary decisions or changes to a business process or to the product/ service of that business. Used together, they provide insight into expected or future performance, including but not limited to business profitability and process efficiency.
Why You Need Metrics and Analytics
”You can’t have analytics without metrics, and metrics alone won’t help you take action, understand what is going on, or help you improve results.
Remember: While revenue may seem like the ‘ultimate’ metric, just the revenue alone won’t help make decisions. In the end, it’s watching and learning from the metrics that you need for your specific product, business model and industry that will help grow your startup into a real business.
Below are more articles on the importance of Metrics and Analytics:
KPI: The Ultimate Measure
When measuring the data or performance, the Key Performance Indicator or KPI is the most essential measure. Unlike metrics and analytics, KPIs are tied directly to business goals and provide actionable insights. KPIs are strategic in nature as they identify the target level of performance at critical stages of a process in a business, thus reflecting the success of a business in terms of achieving defined goals.
KPIs are tracked and evaluated over pre-defined periods or stages. They are then compared to previous data and/or benchmark performance metrics, in order to dive into the effectiveness of processes.
Importance of KPIs
”Every KPI is a metric but not every metric is a KPI
Sample KPIs in Different Development Stages
KPIs
Definition
- The Goal–Which metrics are most important
- Strategic/ critical points of performance
Purpose
- Assess status and performance, especially in the success of specific goals
Examples
- Net Profit Margin
- Monthly Recurring Revenue
- EBITDA (Earnings before interest, taxes, depreciation and amortization)
- Leads generated
- Sales calls made
Metrics
Definition
- The ‘What’
- Different measures to gauge performance or progress
Purpose
- Track status of different aspects of a business, its processes, and products or services
Examples
- Customer Acquisition Cost
- Customer Lifetime Value
Analytics
Definition
- The ‘So What’ or ‘Why’
- Translates metrics
Purpose
- Interprets tracked data into actionable insights and educated predictions
Examples
- Goal Flows
- Event Tracking
Remember: While KPIs, Metrics and Analytics all work together to monitor business effectiveness & performance, one more important intangible factor is gut instinct. There are still some things that can’t be tracked and this is where entrepreneurs can use their gut feeling (together with experience) to pair with metrics in decision-making especially in forecasting performance, which inevitable includes guesswork for startups.
Below are more articles on the importance of Metrics and Analytics:
Defining Your Own Startup KPIs
Success heavily relies on achieving defined goals. To track the numbers that measure performance, start with the bigger picture–the KPIs, to the metrics then use analytics to interpret these metrics.
It is also important to note that the set of KPIs and metrics that you need to track change over the course of development–stage of growth, type of product or service, as well as other internal (financial cost) and external (market behaviour/ volatility, competition) factors.
Characteristics of Good KPIs
Founders need to choose KPIs directly related to your business goals since KPIs are strategic and heavily rely on them. Specifically, startup KPIs should be:
High Impact
Critical to the success of the company’s business goals, as well as relevant to the company’s product, growth stage and industry.
Measurable
Needs to be quantifiable in order to evaluate success more accurately
Specific but Understandable
Clearly define each KPI to be efficient in assessing success or growth. Each team member must be able to break it down.
Actionable
KPIs are only as valuable as the action it influences and in making decisions. What can you do to reach your KPIs? What are the next steps to be taken after the outcome has been analysed?
Timely
Tracked within a specific periods of time; daily, monthly, annually etc. Think about setting KPIs for both short- and long-term goals.
Evolving
Defining KPIs should be an iterative process. Evaluate and redefine your KPIs to fit your business needs continuously. Every business evolves and/or grows. If things are not changing, are you missing specific KPIs to determine why?
Sample KPIs in Different Development Stages
Pre Product-Market Fit
- Qualitative feedback Customer interviews Awareness
- Stickiness: retention & frequency
- Number of pitches per month to potential customers
- Letters of intent secured
Early Startup Stages
- Monthly Recurring Revenue
- Renewals
- Churn
- Customer Satisfaction
- N-day retention
- Session frequency/ session length
Expansion or Scaling
- Cost per acquisition
- Lifetime Value
- Average Order Size
- Number of Customers Acquired
- Revenue per Employee
Remember:
- KPIs are unique for every industry and across various business models. Inspect and think about key measures that are significant to your business structure and product or service. What works for similar businesses won’t necessarily apply to yours.
- Focus on the most important KPIs at each stage of development. Identify KPIs that directly relate to your goals.
Below are more discussions on KPIs:
Startup KPIs: Investor Readiness
What KPIs do potential investors want to see? A great product, product/market fit, and potential for growth demonstrated in numbers. Specifically:
- Illustrate proven traction–covering profitability and reach
- Value creation and retention including product usage metrics
- Market conditions, opportunity and industry growth
- Team execution plan & expansion potential
- Business metrics displaying operational and financial status
”Don’t benchmark on how much your worldwide competitors raised. Money raised doesn’t equal past or future success and every startup has different needs
Daphne LucenetFounder of my MVP and Me & Khmer Vibration
Startup KPIs
KPIs differ per product and industry as mentioned in the earlier sections. This table is a starting KPI list that any founder can work with:
Product-Market KPIs
- Total Available Market/ Industry Growth
- Customer Acquisition Cost
- Conversion Rate
- Customer Lifetime Value
- LTV:CAC ratio
- Churn/ Customer Retention Rate
- Monthly Active Users/ Percentage Active Users
- Month-over-Month (MoM) Growth
- Referral/ Viral Coefficient
- Monthly Revenue Growth/ Revenue Growth Rate
Business and Operational KPIs
- Operating Cashflow
- Net Profit Margin
- Monthly Burn
- Runway
- Product Metabolism
- EBITDA (Earnings before interest, taxes, depreciation and amortization)
- Return on Equity
Remember: If you don’t know what it costs to acquire a customer, consider industry averages or – even better – run a test marketing campaign. The fact is that acquiring a new customer does cost more than keeping an existing customer loyal. Growth in customer acquisition is of course vital and healthy in the long run. But to make informed decisions about how to distribute your customer acquisition strategy, you need to keep good metrics. No vanity data, the more relevant the data for testing very specific hypotheses, the better.
Here are more articles that discuss KPIs for Investor Readiness:
- Top Startup Traction Metrics Considered By Seed Round Investors
- What do Do Investors want to Know About Your Startup?
- The Investor’s Guide to Startup KPIs
- 5 Performance Metrics Your Small Business Should Track
- 12 KPIs you must know before pitching your startup
- KPIs seed investors look for in a company
Startup Metrics
Characteristics of A Good Metric
Criteria to consider when choosing and defining specific business metrics:
- Relevant – aligned with the business goals
- Actionable – allows corrective action to change the outcome and/or improve performance when numbers go up, down or even when they stay the same
- Reliable & Progressive – ability to compare changes, track progress and demonstrate performance over specific periods of time
- Readable & Understandable – does not require deeper explanations; is not difficult to evaluate
Here are additional articles on Startup Metrics:
Metrics for Early Stage Startups
In the early startup stages, the focus is achieving Product-Market fit. The Metrics should demonstrate market potential and show data sufficient enough for product development. Chosen metrics should be able to answer questions such as these in order to move forward with the product or service:
- Is there demand in the market?
- Is there willingness to pay in the defined market? If so, what is the average price they are willing to pay?
- What percentage of the potential market show interest/ converted to being customers?
- How much do customers use the product/service in a specific time interval?
- Are the product features sufficient as a solution to the market problem?
- How can the customer feedback help in Building Your MVP?
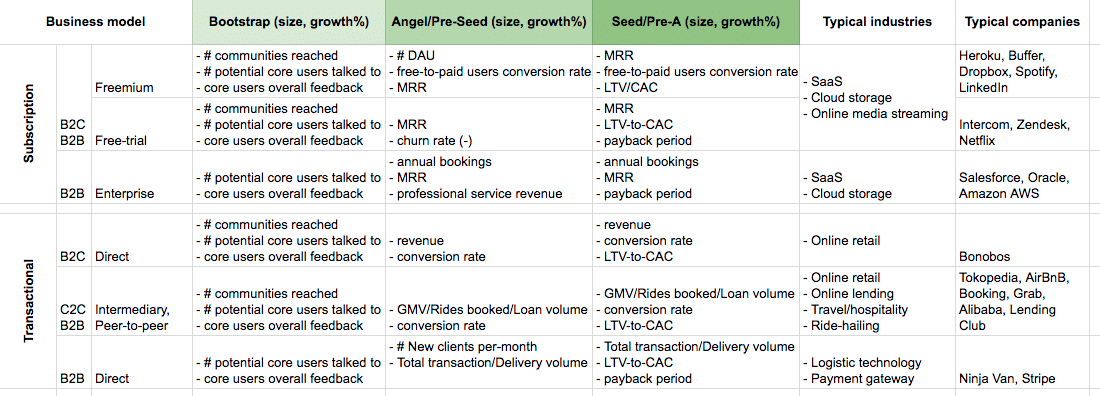
The table below show sample metrics in the early stages of a startup in different industries.
Metrics for Each Startup Stage
The Lean Analytics framework defines each stage differently, with the focus mainly on the target market/ customer journey and interaction.
Empathy
Gathering quality feedback
Mold the solution to fit the market’s needs–solve the problem
Burn rate
Runaway rate
Hero Metrics (OMTM-One Metric That Matters)
Stickiness
Engagement and retention.
How useful is the your product to users?
Active users, Usage Duration, Conversion rate, Churn Rate
Virality
New user acquisition, onboarding and growth.
Convert customers into advocates to speed up the virality
Conversion rate, Churn Rate
Revenue
How to monetise your product or service.
What are the characteristics of highest-converting customers?
Customer Lifetime Value, Ave Revenue per User, Customer Average Lifetime, Customer Acquisition Cost, Return on Investment
Scale
Sustainable/ scalable growth
New acquisition channels
Customer Lifetime Value, Ave Revenue per User, Customer Average Lifetime, Customer Acquisition Cost, Return on Investment
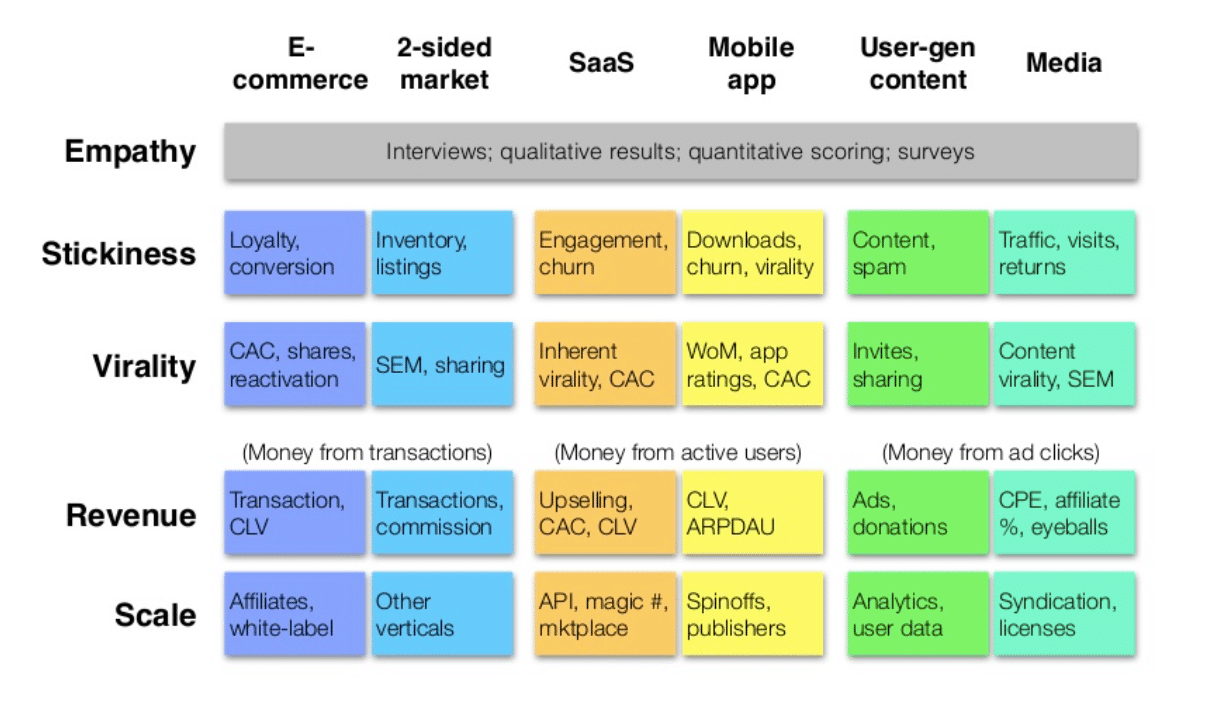
Using the same startup stages above, the diagram below shows different per-stage metrics to track for 6 archetypes of business models–E-commerce, Two-sided Marketplace, Software-as-a-Service/ Freemium, Mobile app or Gaming, and User-generated content:
Sample metrics for other startup development frameworks can be found in this article. Below are more refernces on Startup Metrics:
Metrics Glossary
Lifetime Value (LTV)
How much is expected/predicted to earn from a customer during the period that they avail/use your product/service
Churn or Attrition
Percentage of customers stop paying for your product or service
Burn Rate
How long a business can operate before it runs out of cash
Customer Acquisition Cost (CAC)
How much money is spent to acquire new customers
Monthly Recurring Revenue
Monthly amount paid by customers to use your product or service
Runway
Given the burn rate, how many months can the startup survive if the investor agrees to provide support
LTV / CAC Ratio
Determines if you are spending too much or too little to acquire a new customer. Does the customer create enough value?
Month-over-Month Monthly Recurring Revenue
How fast or slow the business is growing comparatively
Revenue Growth Rate
Increase/ decrease in revenue or sales generated within a specified time period
Operating Cashflow
Amount spent on daily business operations; shows efficiency in coping with expenses and overheads
EBITDA
earnings before interest, taxes, depreciation and amortization
Measure of profitability or the earning potential of your business. Usually used by investors in valuations
Return on Equity
Capacity of a business to be profitable using investor funding; revenue generated for each unit of shareholder equity.
Return on Investment (ROI)
Determines the efficieny of an investment; the ratio of net profit to cost of investment
Product Metabolism
Speed at which you and your company move and make decisions (created by Dustin Dolginow)
Viral Coefficient
Organic growth of the business through user invitation. Considers initial set of customers, Number of invites sent to each new customer, percentage of invites that convert
Conversion Rate
Rate at which a prospect moves to becoming an active user
Customer Retention Rate
Number of customers that stick with your business within a given time period
Referral Rate
Percentage of users who come from existing customers
To learn more about each metric and how to calculate, see the references below:
Actionable vs Vanity Metrics
Because of the myriad of metrics and tools available in the market, founders and CEOs are easily tempted to track all kinds of metrics, including Vanity metrics. As tempting as these may be, Vanity metrics take away attention from the most important (actionable) metrics.
Vanity metrics don’t capture the bigger picture and only exhibit superficial patterns or relationships unlike actionable metrics which are directly related to and aligned with business goals.
”Vanity metrics are dangerous.
Eric RiesAuthor of The Lean Startup
Examples of Vanity metrics are traffic, visitors, click-through rates, impressions, open rates or downloads, and subscribers. None of these provide the relevant and comprehensive insights on product/market fit, how to drive revenue and allocate budget, as well as effectiveness of business processes.
The one possible effect of looking at Vanity metrics is motivating the action of digging deeper and finding out more intrinsic correlations among metrics (when the numbers don’t make sense).
Below are more articles that discuss Vanity Metrics:
Startup Analytics
Dave McClure's AARRR Pirate Framework
Acquisition-Activation-Retention-Revenue-Referral is another framework focused on the Customer Lifecycle, from when a customer comes in contact with your product or service for the first time, to first purchase then upto until advocacy. In this case, the focus and metrics is focused on customer behaviour rather than startup development. Specifically, it inspects each stage of the Customer Lifecycle and the metrics
STAGE
SAMPLE METRICS
Acquisition
Unique Traffic, Visits, Installs/ Uninstalls, Downloads
Activation
Subscribe, Signups, Registrations, Conversions, Bounce Rate
Retention
Session Duration, Daily Active Users, Churn Rate
Revenue
Customer Lifetime Value, Customer Acquisition Cost
Referral
Invites sent, Viral Coefficient (% users who invite others * ave no. invited * % new users who accepted)
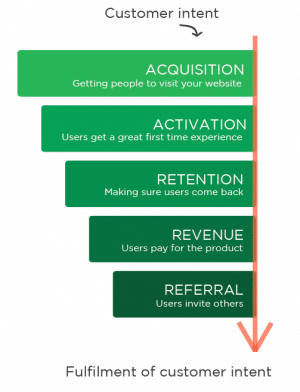
AARRR framework also has its disadvantages. It misses 2 stages before and after: Customer Intent and Fulfillment of Customer Intent, both of which are not measurable by metrics.
A good measure of Customer Intent before Acquisition are interviews, which is covered by the Empathy stage in the Lean Analytics model.
The Fulfillment of Customer Intent, on the other hand can be evaluated by the combination of interview, metrics and KPIs
Analytics Tools for Entrepreneurs
Analytics tools ensure data capture, validation and interpretation. Over time, metrics that you track need to be managed especially in identifying relationships, grouping together related metrics, as well as comparisons to previous data. These are the set of tools, dashboards and/or software that startups need changes with growth and development.
The diagram below further divides development into stages with the corresponding analytics that a startup may need:
Sample Analytics in Different Development Stages
Pre Product-Market Fit
PROTOTYPING & MVP0
FOCUS
Product Insights: How to improve your product
Market traction:
–Managing qualitative data such as customer feedback and interaction
–Willingness to pay for your offering
SAMPLE TOOLS
–Google Analytics
–Mixpanel/Amplitude for product insights
–Chat/ Email tools with data-tracking
–Survey Tools–Surveymonkey, Google Surveys etc.
Early Startup Stages
PRODUCT-MARKET FIT
FOCUS
Conversions: Tracking sources of traffic and contact points
Basic Financial Models: Revenue and Costs
Product Usability: Diagnostic Tools
SAMPLE TOOLS
–Google Analytics
–A/B Testing Tools
–Reporting tools for Revenue
–Google Sheets and Templates
Expansion
SCALING
FOCUS
Most important Metrics based on KPI
Scalable Analytics
Data-testing
Documentation
Data Management Platforms with integrations
Forecasting
SAMPLE TOOLS
–Google Analytics Premium
–Klipfolio
–MySQL
–Amazon Redshift/ Amazon Web Services
More discussion on Startup Analytics here:
Myths and Mistakes
You must report on every single metric.
Your chosen metrics go hand-in-hand with your KPIs, which in turn indicate whether you are in the right track in terms of business goals. Focus on the most important metrics to encourage action and make sound decisions.
Analytics always take a lot of time to measure
The key is to first determine the metrics you need, depending on the current stage of your startup, when to implement it, and how long much data you need to make decisions (depends on the business goals/ the KPI of each stage)
Correlation measures relationship strength
Relying on correlations alone limits perspective. It is important to understand underlying relationships across different variables, within the company and in the market.
Focusing Too Much on the Long-term or Short-term
Take time to understand your metrics. Have strategic checkpoints– daily, weekly, monthly.
More Myths on Startup Analytics on these links: